Our bearish thesis on the drug trades generally and PBMs specifically has several moving parts; of these, the effect of the AWP[1]benchmark on generic dispensing margins is key
The heart of the matter is that AWP is very tightly correlated to actual brand acquisition costs, but not to generic acquisition costs; this leads to a pair of effects that tend to support generic dispensing margins, one on which we’ve published extensively (information asymmetry between plan sponsors and PBMs), and another which is new to us (the existence of an apparent price equilibrium point for generic dispensing margins). If AWP is replaced as we believe it soon will be, both of these effects disappear, and generic dispensing margins should fall
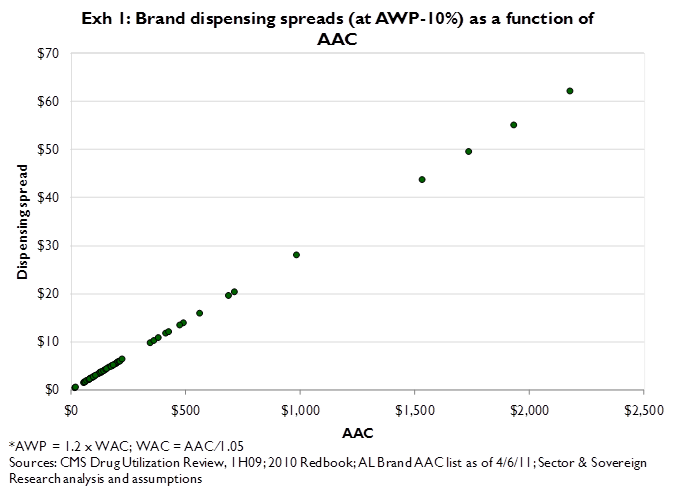
Reviewing briefly, AWP is simply 1.2 x WAC[2], and WAC for all intents and purposes is manufacturers’ list price. With very few exceptions, brand manufacturers do not offer discounts to the drug trades, so list price, WAC, and the actual price paid by the trades to acquire a given brand drug from the manufacturer are essentially equal. And, because WAC ≈ true acquisition cost and AWP = 1.2 x WAC, AWP bears a consistent (≈ 1.2 x) relationship to the trades’ cost of acquiring a brand; i.e. an AWP-based benchmark ‘functions’ as an accurate cost-plus pricing reference for the branded drugs in a PBM contract. Exhibit 1 shows the direct relationship between actual acquisition cost (AAC, x-axis) and the dispensing spread for a typical AWP-based (AWP – 10%, y-axis) level at which a plan sponsor might reimburse a PBM for dispensing a brand. In simple game theory terms we can say that in the brand pricing relationship, no information asymmetry exists between the drug trades (seller) and plan sponsors[3] (buyer)
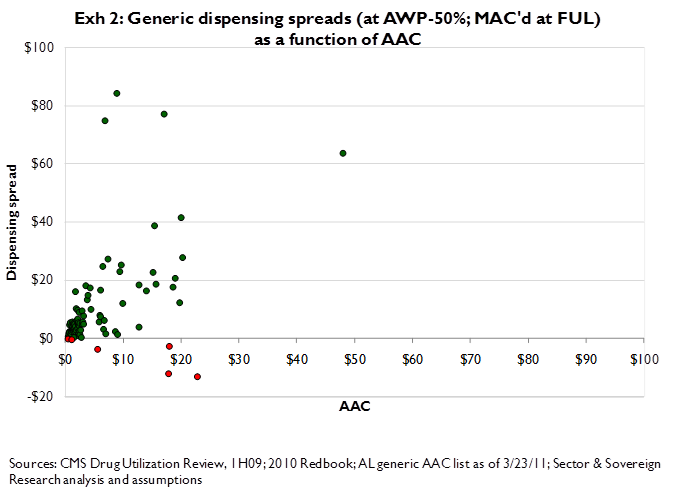
In sharp contrast, because generic manufacturers routinely sell to the drug trades at prices below list, and because these actual sales prices vary greatly relative to list, AWP bears almost no relationship to the trades’ acquisition costs for generics. Accordingly an AWP-based benchmark cannot function as a cost-plus pricing reference in a PBM contract. Exhibit 2 shows the (highly disparate) relationship between pharmacies’ actual acquisition cost (AAC, x-axis) and the spread on typical AWP-based payment terms (AWP – 50%, or if an FUL[4] exists, reimbursement is MAC’d[5]). In this case an information asymmetry plainly does exist; the drug trades can see their actual acquisition costs, but plan sponsors (who only see AWP, which is unrelated to acquisition costs) cannot
Until now, we’ve relied on this AWP-based information asymmetry as an explanation for why generic dispensing margins are higher than brand dispensing margins – the classic theory being that the party with better information (the drug trades) will capture a greater share of the available value, thus the existence of higher dispensing margins for generics (where an information asymmetry favors the trades) than for brands (where no information asymmetry exists).The common pushback here is that plan sponsors, realizing the drug trades are making more on portfolios of generics than on portfolios of brands, should simply increase the average generic discount relative to AWP, so that average generic dispensing margins fall to the desired (presumably brand) level. The problem is, they can’t. For argument’s sake, assume that average brand dispensing margins represent a ‘correct’ pricing[6] of PBM services between a fully informed buyer (plan sponsor) and seller (PBM), since no information asymmetry exists in brand pricing. Using recently available Alabama AAC[7] data, we estimate that pharmacies make roughly $5.77[8] dispensing margin for each brand prescription[9], versus $9.01 for each generic prescription[10]
Because the Alabama AAC data allow us to relate acquisition cost (AAC) and payment (AWP – X% or MAC) terms on a drug by drug basis, we can calculate dispensing margins at the individual drug level, and show what happens to a ‘portfolio of dispensing margins’ if a plan sponsor forces the AWP discount to a point at which the average generic dispensing margin is equal to the average brand dispensing margin – specifically, the percentage of generics with negative dispensing margins rises, and arguably passes a critical threshold, i.e. a point at which the trades cannot simultaneously accept the AWP-based reimbursement terms and commit to stocking and dispensing all approved generics
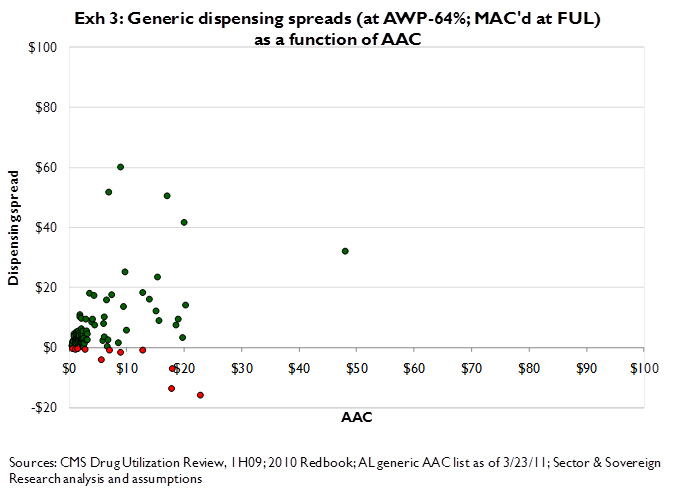
Looking back at Exhibit 2, we see the dispersion in the relationship between acquisition cost (AAC) and what we would argue are typical generic payment terms (AWP – 50%; MAC’d at FUL). The green observations are positive dispensing margins; the red observations are money-losing. And, as we’ve shown, a pharmacy makes an average generic dispensing margin of $9.01 on these payment terms. To force the average generic dispensing margin across this portfolio[11] to the estimated brand level ($5.77), we have to increase the AWP discount to 64%, i.e. the payment terms become AWP – 64%, as opposed to AWP – 50%, both MAC’d at FUL. The resulting relationship between acquisition cost and reimbursement is shown in Exhibit 3; in addition to lowering average generic dispensing mark-ups to the brand ($5.77) level, the lower payment terms have also forced a greater proportion of the generic portfolio into negative dispensing margins
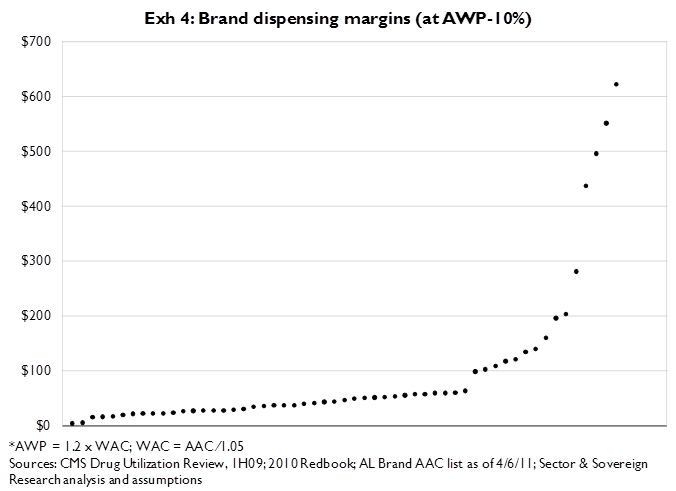
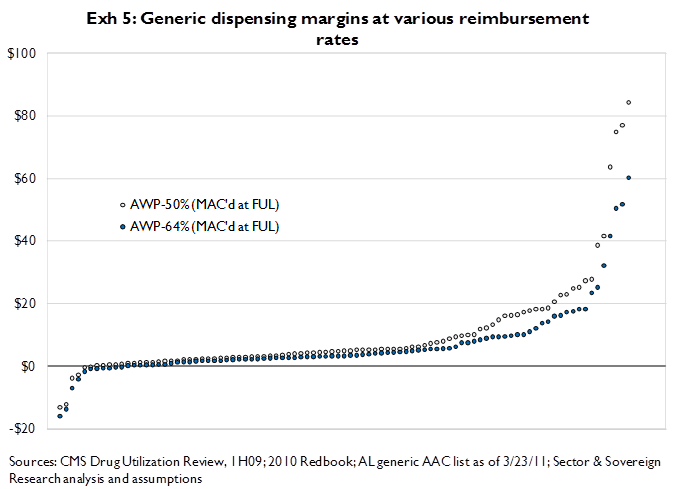
Another way to look at this is to simply rank-order brand and generic dispensing margins according to payment terms. For brands, assuming reimbursement of AWP-10%, we find the distribution of dispensing margins shown in Exhibit 4. The key point here is that all of the brands are money-making, since any payment terms more generous than roughly AWP – 20%[12] by definition create a positive dispensing margin. Generics are another matter entirely. Exhibit 5 orders generic dispensing margins from low to high; we see that some prescriptions are money-losing at current assumed payment of AWP – 50%; MAC’d at FUL (where dispensing margins average $9.01), and that substantially more prescriptions are money –losing as we force terms to a point (AWP – 64%; MAC’d at FUL,) at which dispensing generic and brand dispensing margins are equal [13]. Much more importantly, note the ‘slope’ of generic dispensing margins at the point of intersection with X = $0 – at present AWP-based generic reimbursement levels, we are at precisely the point upon which very small additional discounts to AWP produce very large increases in the percentage of generic scripts that lose money. This looks for all the world like a natural price equilibrium point, but only so long as the AWP-benchmark endures
This apparent price equilibrium in (AWP-based) generic dispensing margins is consistent with the notion that the market for generic dispensing mark-ups is competitively efficient, but structurally inefficient. I.e. it may well that generic dispensing margins are ‘super-normal’ more because of a structural artifact (if plan sponsors lower AWP-based generic reimbursement any further the drug trades begin to lose money so quickly that none will agree to the marginal drop in price) than because of limits on plan sponsors’ ability to negotiate (specifically, our heretofore much cherished information-asymmetry hypothesis)
Thus for generic dispensing margins to fall, the AWP benchmark has to go. As long as AWP remains the standard, plan sponsors will not be able to lower generic dispensing margins (meaningfully, if at all), even if we assume (as we do) that plan sponsors have considerable negotiating leverage over PBMs, and that this leverage is growing. By extension, we also now realize that the path to lower generic dispensing margins probably cannot be gradual (i.e. continued steady emergence of informed negotiating power), it is far more likely to be abrupt (a collapse of the AWP benchmark)
Because alternative acquisition cost benchmarks are emerging, we expect AWP soon will go, and that generic dispensing margins will abruptly fall. As we’ve reported previously, the HHS Secretary has publicly committed[14] to providing a national version of AAC by the end of this year, and CMS has separately confirmed to us the agency’s intention to follow through on provisions in the Affordable Care Act (ACA) which require publication of Average Manufacture Price (AMP)[15]. There is a range of feasible scenarios under which AWP is replaced by either of these acquisition-cost based standards, both in terms of when the first replacements take place, and the time required for all commercial contracts to make the shift. We’re convinced the states are done with AWP by late this year / early next; however, we believe that either of two things must happen before AWP is replaced in commercial contracts: 1) the primary sources of AWP (e.g. First Data Bank, Medi-Span) must stop publishing the benchmark; or, 2) either AAC or AMP becomes a trusted standard, by which we mean plan sponsors gain faith the benchmark(s) will survive legal challenges. The first event (no publication of AWP) is theoretically possible as early as 4Q11, but is unlikely to occur this quickly. The second event (an acquisition cost index that survives judicial challenges) is highly likely (especially given two shots on goal), but takes time, perhaps well into 2012, or even further. The almost certain adoption of AAC by the states[16] later this year presumably forces the drug trades to accelerate any challenges to the AAC standard, which should serve to settle questions of legality more quickly, thus our belief that we’re likely to see a reliable acquisition cost benchmark established in 2012
Once a dependable acquisition cost benchmark exists, we’re left with the matter of whether commercial contracts shift all at once, or more gradually as AWP-benchmarked contracts expire and are replaced by contracts with acquisition cost benchmarks. Assuming AWP is not effectively withdrawn, the time required to replace AWP with an acquisition cost benchmark becomes primarily a question of relative plan sponsor / PBM negotiating strength, and secondarily of the net savings available to plan sponsors who replace AWP-benchmarked contracts before their agreed termination dates. We’re convinced that plan sponsors have sufficient leverage to insist on their preferred benchmark, and that their leverage is growing, leaving the question of whether the available savings warrant early re-negotiation – and we plainly believe they do. Realistically these two questions are related; in a PBM services contract cycle wherein ‘up-for-renewal’ plan sponsors are gaining substantial savings by virtue of shifting their benchmarks, we do not believe PBMs have sufficient negotiating leverage to hold AWP-based plan sponsors to the old standard, as each PBM presumably would shoulder the early termination costs for its competitors’ sponsors in order to gain the marginal business
[1] Average Wholesale Price
[2] Wholesale Acquisition Cost
[3] For brands, the trades can see both their actual acquisition costs and AWP; the sponsors can only see AWP. But since AWP bears a known, consistent relationship to actual acquisition costs, sponsors can accurately infer true acquisition cost drug by drug, and dose by dose
[4] FUL = Federal Upper Limit, a maximum price for Medicaid reimbursement set by CMS
[5] MAC = Maximum Allowable Cost. MAC lists have a variety of origins, so while MAC consistently ‘means’ the maximum price at which a given payor will reimburse for a given generic, the actual value of MAC varies by payor (and often also by provider for the same payor)
[6] In reality we think current brand dispensing margins are inflated by a cooperative oligopoly among the full-service PBMs, that this cooperative oligopoly unravels as the utility of these PBMs’ capital-intensive call centers and mail order facilities wanes, and that brand dispensing margins fall as a result. To be clear, we’re using the term ‘cooperative oligopoly’ in a purely objective sense to describe the pricing dynamic typical of concentrated service providers; we do not believe nor are we inferring that de facto price collusion takes place among the PBMs
[7] AAC = actual acquisition cost. Alabama’s AAC data reflect Alabama pharmacies’ actual net cost of acquiring specific drugs at specific dosages, both brand and generic. It is reasonable to assume – and we do – that Alabama AAC levels correlate tightly with national AAC levels; however, we acknowledge that the mix of generics dispensed in Medicaid differs somewhat from commercial generic mix, and that Alabama Medicaid generic mix may differ from national Medicaid generic mix
[8] We recognize that this figure is less than the roughly $9 brand dispensing margin estimate we’ve published elsewhere. The $5.77 we use here is an estimate; the noise in the estimate lies in the pricing assumption (9%) we use to inflate our most recently available (2010) AWP data to the present, to correspond with the vintage (2011) of the Alabama AAC data. The $9 estimate we’ve published previously is based largely on data acquired by FTC under subpoena from PBMs in 2005; the FTC data have the advantage of being apples to apples with respect to pricing inputs, but are disadvantaged by the fact that 2005 product mix (both generic v. brand, and age-mix of generics) is very different than 2011 product mix
[9] We assume brand reimbursement is set at AWP – 10%
[10] We assume generic reimbursement is set at the lower of AWP – 50% or MAC. Where an FUL exists for a given product, we assume that MAC = FUL
[11] The model portfolio includes a sample of >1,400 NDCs for products accounting for 64% of 1H09 Alabama Medicaid prescriptions
[12] Ignoring independents’ fees to wholesalers
[13] The numbers, based on our analyses of the Alabama AAC dataset: at present brand and generic reimbursement levels, we estimate average brand dispensing margins of roughly $5.77, and average generic dispensing margins of roughly $9.01. At these reimbursement levels all brand prescriptions have positive dispensing margins; however we estimate that 9.0 percent of generic drugs have negative dispensing margins, and that these drugs represent 4.2 percent of generic prescriptions dispensed. If we lower generic payment terms such that brand and generic dispensing margins are equal, 13.4 percent (an increase of 49%) of generic drugs have negative dispensing margins, and these drugs represent 6.2 percent (an increase of 48%) of generic prescriptions dispensed. Also, the relative value of money-making and money-losing prescriptions shifts as we lower generic reimbursement. Under current terms we estimate that the average money making generic prescription makes $9.85, and that the average money-losing generic loses $10.30. If we lower generic payment terms so that brand and generic dispensing margins are equal, then the average money making generic delivers (only) a $6.88 dispensing margin (a decline of 30%), and the average money-losing generic prescription loses $10.93 (6% larger average loss)
[14] http://www.hhs.gov/news/press/2011pres/01/20110203c.html
[15] Both indices reflect true acquisition costs; AAC approaches acquisition costs from the perspective of the trades (via a survey of pharmacies); AMP approaches acquisition costs from the perspective of the generic manufacturer (AMP is a net price calculation that manufacturers are required to report to HHS; with minor exceptions AMP is highly correlated with actual selling costs to the trades, i.e. with the trades’ acquisition costs)
[16] Please see our March 22, 2011 note: “Medicaid Cost Pressures Intensify on States …”
